
Understanding the Yield Curve: Why Inversions Signal Recessions
When short-term interest rates climb above long-term ones, the yield curve flips upside down, a quiet but powerful signal that markets expect slower growth, tighter lending, and a possible recession ahead.
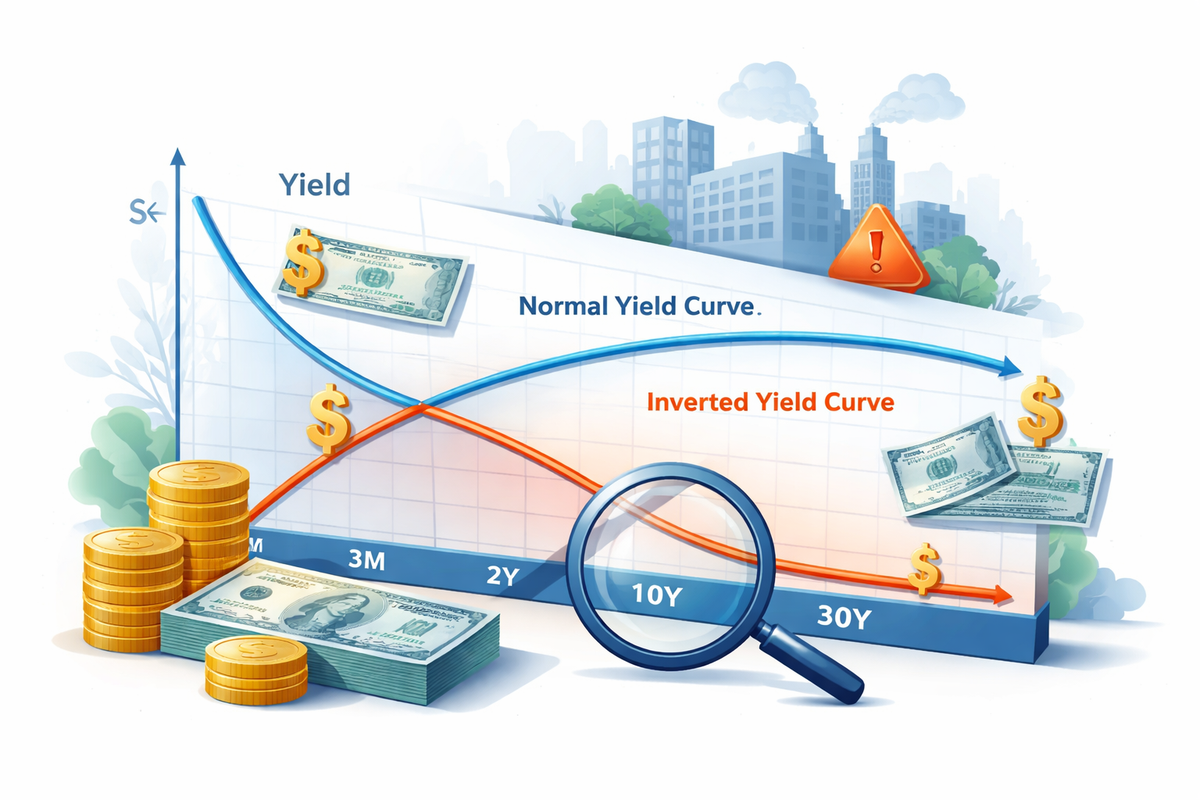
The yield curve is a foundational concept in finance that plots the interest rates (yields) of government bonds across different maturities, from short-term bills to long-term notes. In a typical economic environment, investors demand higher yields for longer maturities because they take on greater risks, such as inflation and uncertainty over time, so the curve slopes upward. This normal shape reflects confidence that the economy will grow and interest rates will remain stable or rise moderately.
A yield curve inversion occurs when short-term government bond yields rise above long-term yields, signalling that investors expect slower growth and possible economic weakness ahead. When the yield curve inverts, meaning short-term interest rates exceed long-term rates, it signals a remarkable shift in market sentiment. This inversion usually occurs when investors grow concerned about future economic conditions and seek the relative safety of long-term government bonds. Heavy demand for long maturities pushes their yields down, while short-term yields stay elevated, often due to central bank policy or tight financial conditions.
The most common time period used to gauge the yield curve is the 10-year vs. 2-year Treasury spread, because it combines a liquid short- to medium-term rate with a widely followed long-term benchmark that historically signals economic expectations and recession risk. This 2-year/10-year spread has been one of the most reliable recession predictors, with inversions preceding every U.S. recession in recent decades.
What makes inversions particularly noteworthy is their historical association with economic recessions. Since the 1970s, every U.S. recession has been preceded by an inverted yield curve, as measured by the spread between two-year and ten-year Treasury yields. This regular pattern has led economists to treat an inversion as a reliable leading indicator, typically foreshadowing an economic contraction 6–18 months before it begins. Its credibility strengthened after accurately preceding the 1973–75 recession and every major U.S. recession that followed, making it a core macroeconomic signal from the 1980s onward Its credibility strengthened after accurately preceding the 1973–75 recession and every major U.S. recession that followed, making it a core macroeconomic signal from the 1980s onward. Research from institutions like the Federal Reserve Bank of New York further formalized its predictive power in the 1990s by modelling recession probabilities using the 3-month/10-year Treasury spread.
One well-documented case is the 2006 yield curve inversion, when the U.S. 2-year Treasury yield rose above the 10-year yield. This inversion occurred more than a year before the Great Recession, which officially began in December 2007, illustrating how an inverted yield curve can precede an economic downturn by many months.
There are both predictive and mechanical reasons behind this pattern. On the predictive side, an inverted curve reflects market expectations of lower future interest rates and slower growth, often prompted by recession fears. On the mechanical side, research from the Federal Reserve shows that banks, which borrow short and lend long, may tighten lending when the curve inverts because their profit margins shrink. Reduced lending can slow business investment and hiring, reinforcing the economic slowdown.
It is important to note that while yield curve inversions are strongly correlated with recessions, they do not cause them outright nor guarantee one in every cycle. Some recent inversions lasted longer or have not immediately led to a contraction, suggesting that other factors, such as global demand for safe assets or shifts in inflation expectations, can also influence the curve. Still, economists and market participants closely watch yield curve behaviour because it encapsulates collective forecasts about economic prospects.
Historically, yield curve inversions have been remarkably reliable recession indicators, but there have been a small number of instances where an inversion did not result in an official U.S. recession. Two commonly cited examples are 1966 and 1998. In 1966, the curve inverted amid Federal Reserve tightening, leading to a sharp economic slowdown but not a formally declared recession by the National Bureau of Economic Research. Similarly, in 1998, the curve briefly inverted during the global financial turbulence following the Russian debt crisis and the collapse of Long-Term Capital Management, yet the U.S. economy continued expanding. These episodes are often described as “false positives,” though in both cases growth decelerated significantly, reinforcing the idea that inversions still signal stress even when a recession does not immediately follow.